Google Analytics 4 has the ability to natively track outbound link clicks without the use of JavaScript or Google Tag Manager. Unfortunately, it makes you jump through some hoops to see the data. In the article, I’ll explain how to set up a Google Analytics 4 Exploration to track outbound link clicks on your website.
I first learned how to do this from an article on Julius Fedorovicius’ great Google Analytics blog. But I wanted to make my post a bit more concise and mention a few caveats.
1. Make Sure “Outbound Clicks” Is Enabled in Enhanced Measurement
The first thing you should do is verify that “Outbound clicks” is enabled:
Go to: Admin (gear icon in lower left corner) -> Data Streams -> Enhanced Measurement -> Click your site name
Once there, click “+ 3 more” in the Enhanced Measurement section to show all of the items you’re measuring. Make sure “Outbound clicks” is one of them.
If not, add it by clicking the gear icon.
2. Create an Exploration
The next thing you want to do is create an “Exploration”, which is just a fancy name for a custom chart. In my opinion, outbound clicks should have been a preset chart in GA4, but whatever.
In the left sidebar menu of Google Analytics 4, click on Explore, then click the plus sign to create a blank Exploration.
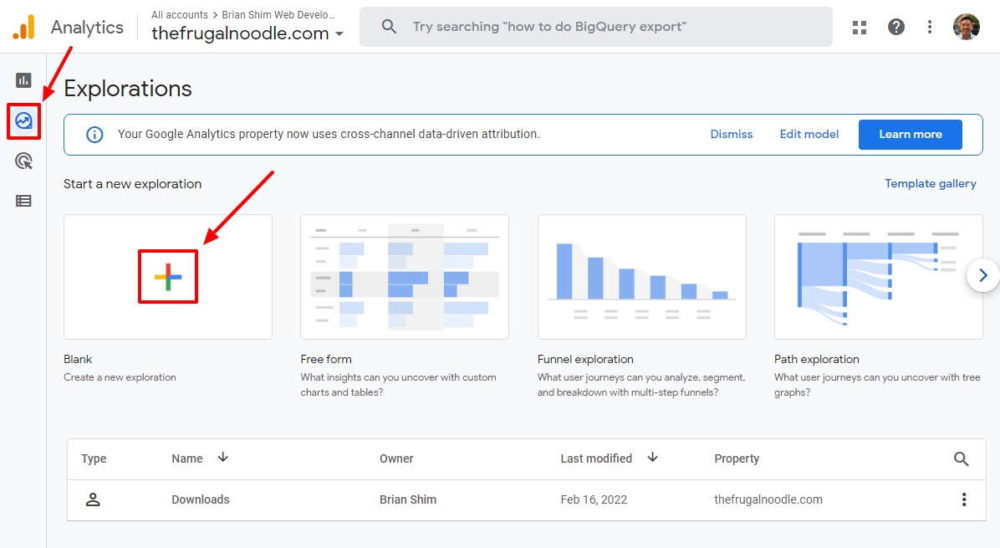
In the top left, change the Exploration Name to something that makes sense to you, such as “Outbound Link Clicks”.
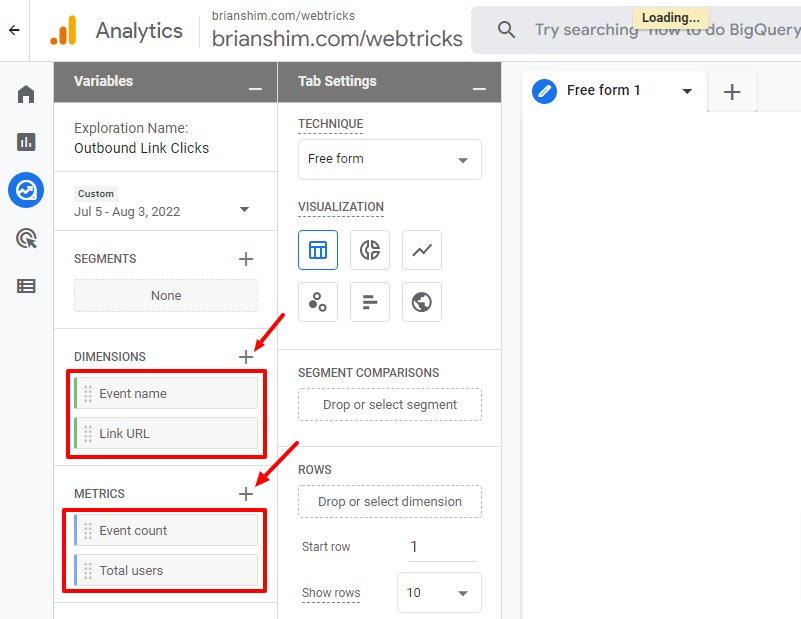
3. Add Dimensions and Metrics to the Exploration
In the left Variables column, find the DIMENSIONS area and use the plus button to add “Event name” and “Link URL”.
Similarly, in the METRICS section, use the plus button to add “Event count” and “Total users”.
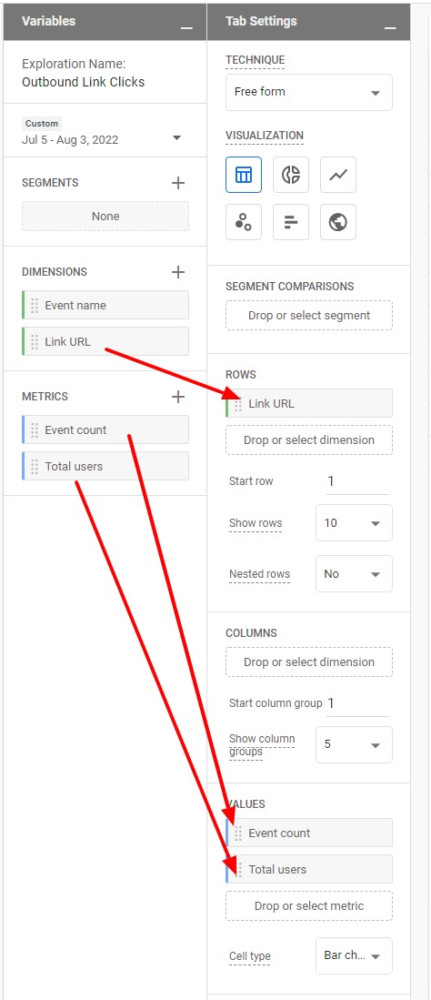
4. Move Dimensions and Metrics to Rows and Values
Once you’ve added the proper variables in the Variables column, they become available to add to the Tab Settings column.
An easy way to add variables to the Tab Settings column is to simply double-click them. So, double-click on “Event name”, “Event count”, and “Total Users” to add them to the ROWS and VALUES sections as shown:
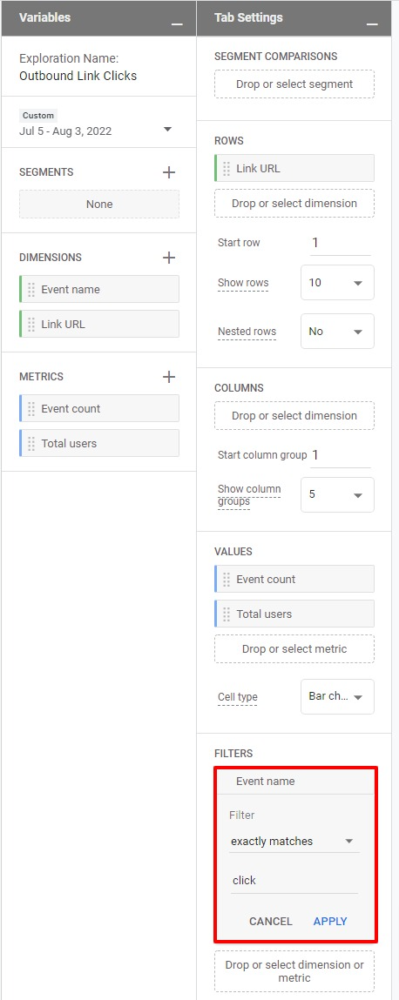
5. Set Filters
You need to filter the result so that only clicks show up in the graph. Go to the FILTERS section. Click it and select Event name, then set it to “exactly matches” “click” and hit APPLY as shown:
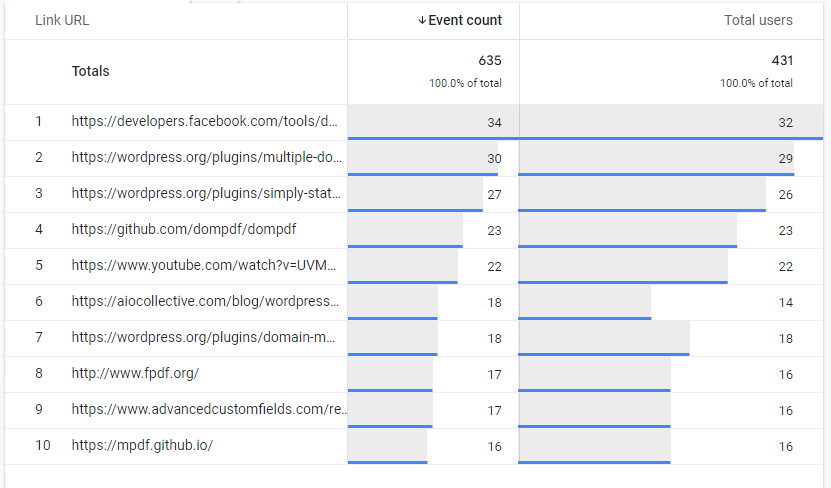
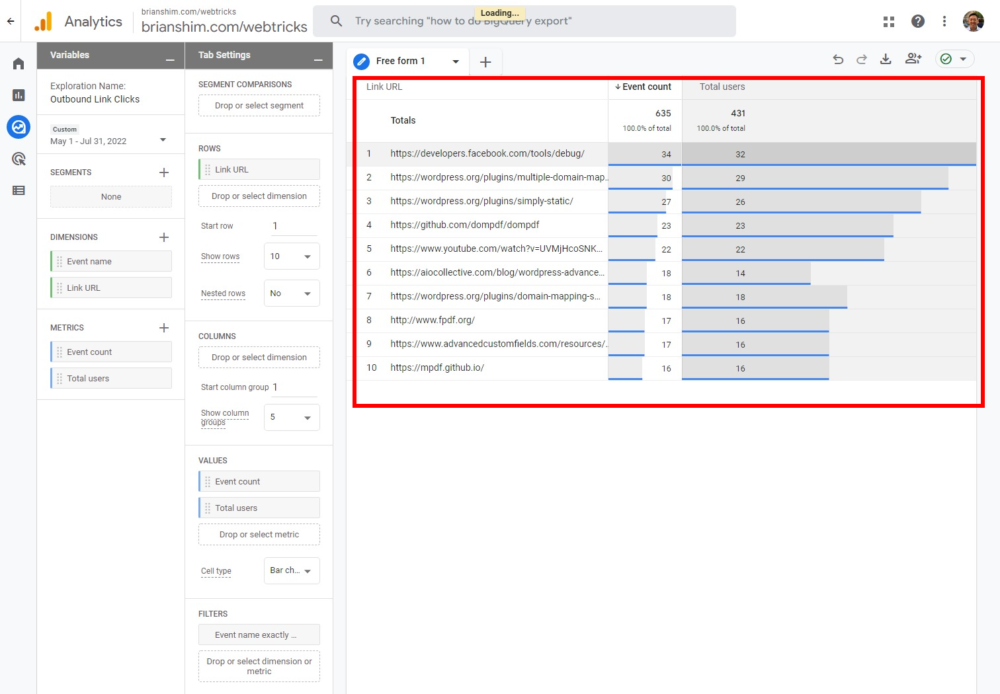
Once you’ve done that, you should see a nice graph to the right showing outbound URLs showing clicks, and number of users who clicked:
6. Set Date Range
Near the top of the left Variables column, you can set the date range for the chart.
7. More Filters (Optional)
Your graph may show clicks on other types of links such as “mailto:”, “tel:”, and JavaScript events. Julius shows how to filter these out in his article. I personally like to see these in my reports though!
That’s it! Now, any time you want to see outbound link clicks, just go to Explorations and select this graph.
A Huge Bug on Some Sites
This works great for a lot of sites, but unfortunately, there is a bug that caused link click tracking to stop working for a time in June and July 2022 for some sites. A ticket has been filed with Google and I’m hoping for a resolution to this. I’ll update this article accordingly.
Hope this helps! Did it work for you? Please leave a comment below. – Brian

I am a freelance web developer and consultant based in Santa Monica, CA. I’ve been designing websites using WordPress and from scratch using HTML, CSS, PHP, and JavaScript since 2010. I create websites and web applications for businesses, nonprofits, and other organizations. I have a degree in Electrical Engineering (BSEE) from California Institute of Technology and a degree in Engineering Management (MSEM) from Stanford University.
Discover more from Web Developer Tips and Tricks
Subscribe to get the latest posts sent to your email.
Please Leave a Question or Comment